Study of the Impact of Instructional Coaches on Middle School Teachers and Student Achievement
The El Paso MPS study of the Impact of Instructional Coaches on Middle School Teachers and Students has produced a rich data base on the effects of "instructional coaching" and the conditions under which it seems to produce strong effects. The major findings of the study are as follows:
- The practices and strategies of the coaches varied across schools and districts. Data from the logs and interviews revealed four distinct approaches among the 24 staff developers: Analyst (n=8), Proceduralist (n=4), Mentor (n=9), and Helper (n=3).
- Teaching practice improved in many of the classrooms in which the coaches were working, and it improved in the areas that they were focused on.
- Students taught by a science teacher who participated in intensive work with a coach scored 33 points higher on the Texas Assessment of Knowledge and Skills (TAKS) science test in 2007 than other students.
- The analyses of specific staff development activities and student achievement revealed that the core strategies of the MSP science coaches were significantly positively related to improved student performance in science during the 2006-07 school year.
- School contexts varied and influenced the work of the coaches; critical variables included principals' stance towards the availability and role of coaches; the school schedule and department meeting times; the professional culture of the school; and teachers' perceptions of their areas of need.
- Coaches reported differing levels of interest in and support for their work, as well as different approaches to structuring and managing their work by the district
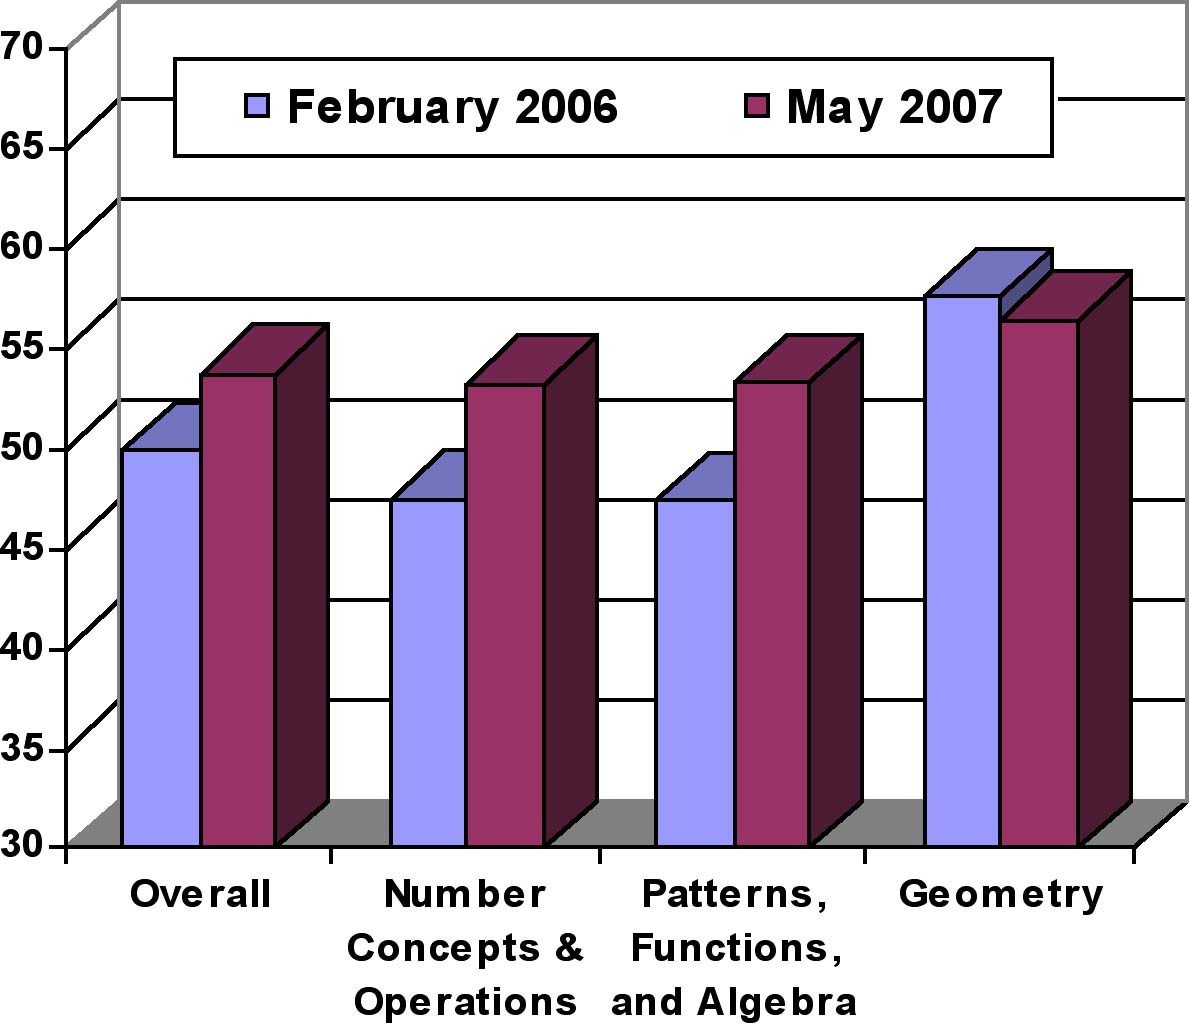
- The application of the PCK survey to math teachers in 2006 and 2007 showed some significant growth in their pedagogical content knowledge, but that growth was not related to improvements in mathematics student achievement on TAKS.
HLM Coefficient Estimate | Subject | |
Math | Science | |
Relative Performance Gain | -9.21 | 33.15*** |
Standard Error | (11.36) | (9.22) |
Staff Development Activity | School Year & Subject | |||
Math | Science |
|||
2005-06 |
2006-07 | 2005-06 | 2006-07 | |
Work with Individual Teachers |
|
|
|
|
Classroom Observation | 0.98 | -0.86 | 0.39 | 1.13~ |
Co-Lesson Planning | 0.61 | 0.20 | 0.79 | 7.45*** |
Co-Teaching | 0.60 | 0.10 | 0.21 |
2.39* |
Data Analysis | 2.81 | 1.46 | 21.62 | 3.29 |
Assessment | 8.60 | -5.30 | 6.89 | -18.58 |
Debriefing/Reflection | 0.96 | 0.68 | 3.15 | 1.57 |
Figure 1. Pedagogical Content Knowledge for Teaching
Mathematics (PCK)
Pre-Post Scores from February 2006 to May 2007
(N=45)

Students' TAKS Performance in Math
HLM Predictor Variable | School Year | |
2005-06 | 2006-07 | |
PCK Score | -1.09 | -0.78 |
Gain in PCK Score |
| -0.08 |


